


Study design and participants
An overview of our experimental design is depicted in Supplementary Fig. S1. Of the 1206 mothers with HMO profiles in the CHILD Cohort Study, 980 had been genotyped and included in our GWASs of HMOs (names and abbreviations in Supplementary Table 1; distributions in Supplementary Figs. S2, S3; clustering in Supplementary Fig. S4). Characteristics of these 980 mothers are summarized and compared to 2370 mothers with genetics data only in Supplementary Table 2. The characteristics of their children are shown in Supplementary Table 3. Of the 980 mother-infant dyads, only 880 children were fed with human milk from their mothers until 6 months or longer. Therefore, these 880 kids were included in the gene-environment interaction (GxE) analyses that integrated their individual genetic risk and their mothers’ HMO measures as the exposure variables. GWAS analyses including over 5.4 M SNPs identified both known and novel maternal genomic factors associated HMOs. Subsequent GxE analyses determined that exposure to specific HMOs (e.g., 2’FL, DFLNH) were associated with lower prevalence of recurrent wheeze among milk-fed infants, particularly among children with high genetic risk (calculated based on SNPs previously associated with asthma12).
GWASs of maternal HMOs identified known and novel genetic associations
In our GWAS of secretor status, 727 of the 980 mothers (73.7%) with both genomics and HMO profiles were classified as secretors, based on high abundance of 2’-fucosylactose (2’FL) in their milk (>200 nmol/mL). GWAS of this binary trait identified 265 SNP associations on chromosome 19q13.33, which harbors the FUT2 gene (significant SNPs listed in Supplementary Data 1). These represent both novel and known associations, including two stop-gain variants (rs601338, rs681343 P = 9.14e–51, β = 0.004) previously associated with secretor status in Caucasians, and a third missense variant (rs1047781), previously reported in East Asians (P = 1.13e–10, β = 0.06)13.
In our GWASs of individual and total HMO abundances, we identified 411 SNPs associated with continuous concentrations of the 19 individual HMOs, total HMOs, HMO-bound fucose and HMO-bound sialic acid. GWAS results were overlayed in Fig. 1a and shown individually for each HMO in Supplementary Fig. S5. SNP associations are listed in Supplementary Data 1, independent SNPs (r2 ≤ 0.6) included in Supplementary Data 2, and 23 lead SNPs (r2 ≤ 0.1) shown in Table 1, Supplementary Fig. S6 and annotated in Supplementary Data 3. These associated SNPs span 4 genomic regions on chromosomes 3, 10, and 19p and 19q, as described below. GWASs limited to central European participants showed similar association signals on chromosomes 3 and 19 (see Supplementary Fig. S7 and Supplementary Data 4). GWAS of HMOs stratified by secretor status identified similar associations on chromosome 19 (Supplementary Fig. S8).

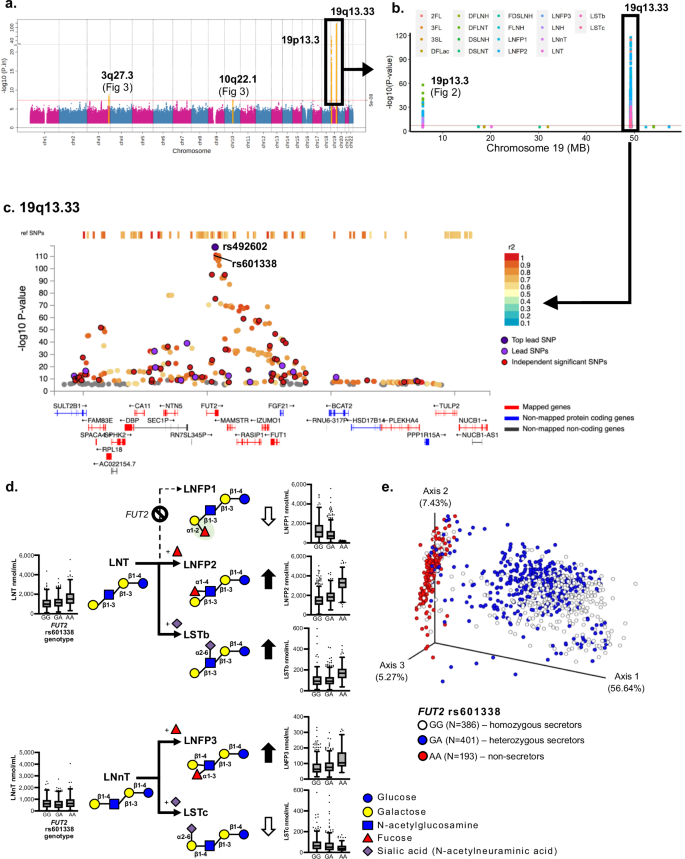
a Overlayed Manhattan plots from GWASs of 19 HMOs (linear regression analyses in PLINK): significant association of SNPs across four chromosomal regions, the strongest association at rs492602 on chromosome 19q13.33 for LNFPI (P = 2.38e–118). Additional associations were detected on chromosomes 19p13.3, 3q27.3 and 10q22.1 (Supplementary Data 1). The x-axis indicates the chromosomal position, and the y-axis indicates the significance of SNP associations (-log10(P)). The red line represents the genome-wide significance P-value threshold (P < 5e–8). The orange highlight SNPs within each of the significant regions. b Overlayed regional plots of SNP associations on chromosome 19: significant associations were detected for 18 of the 19 individual HMOs (all except 6’SL). The red horizontal line represents the genome-wide significance threshold (P < 5e–8). c Overlayed Locus Zoom plots of chromosome 19q13.33: 324 SNPs were associated with individual HMOs. The most significant SNP (rs492602, P = 2.38e–118) is indicated by a dark purple dot, which is in LD (r2 = 0.99) with the known stop-gain variant rs601338 in the FUT2 gene. The x-axis shows genes mapped to this associated genomic region (250 kb) and y-axis indicates the significance of SNP associations (-log10(P)). d Metabolic flux from LNT and LNnT to fucosylated or sialylated pentasaccharides and corresponding HMO concentrations associated with rs601338 in the FUT2 gene. The illustrated metabolic pathway shows that this SNP is associated with almost all HMOs, not just the ones that are alpha1-2-fucosylated (e.g. 2’FL or LNFP1). The green oval highlights the alpha1-2-linked fucose. Boxplots show select HMO concentrations associated with rs601338, supporting the illustrated synthesis pathways (N = 980). Box minimum: Q1, box maximum: Q3, box center: median, whiskers (farthest points that are not outliers (i.e., within 3/2 times of interquartile range). e Principal Co-ordinate Analysis (PCoA) plot of overall HMO profiles by SNP rs601338 genotypes using a Bray-Curtis distance matrix. Subjects by genotype: GG, N = 386; GA, N = 405; AA, N = 190. Each dot represents the entire HMO profile of an individual mother. Variations along the primary axis, accounting for 56.6% of overall HMO concentrations, were strongly associated with the stop-gain variant rs601338 in the FUT2 gene.
We identified 66 independent (r2 < 0.6) SNP associations at the chromosome 19q13.33 genomic region, which span multiple genes including FUT2, FUT1, NTN5, CA11, MAMSTR, RASIP1, IZUMO1 (Fig. 1c). This region was associated with 18 of the 19 HMOs (all except 6’SL). These SNPs were generally associated with decreased concentrations of total HMOs and HMO-bound fucose; and increased concentrations of HMO-bound sialic acid (Table 1, Supplementary Data 1 and 2). The most significant association was a synonymous SNP (rs492602, P = 2.38e–118, β = –0.96) in the FUT2 gene, correlated with decreased concentrations of LNFP1. Although FUT2 encodes for an alpha1-2-fucosyltransferase, SNPs in this gene were not only associated with decreased concentrations of alpha1-2-fucosylated HMOs (e.g., 2’FL and LNFP1), but also with LSTc, 3’SL (Fig. 1d, Supplementary Data 1, 2). Notably, non-fucosylated precursors such as LNT as well as alternative products (LNFP2, LNFP3, LSTb and LSTc) were also associated with FUT2 SNPs in both negative and positive directions; these observations align with the known biosynthetic interconnectivity of individual HMOs in vivo (Fig. 1d). This interconnectivity is further illustrated by visualizing the impact of FUT2 secretor status on overall HMO composition (reflecting all 19 HMOs) using a PCoA analysis, where each milk sample was plotted in a three-dimensional space. For example, samples from women with the FUT2 SNP rs601338 clustered in a significantly different part of the PCoA space with separation along the prime axis, which accounted for over 56% of the variation in overall HMO profiles (Fig. 1e).
We identified 26 independent association signals in chromosome 19p13.3, which consists of genes FUT3, FUT6, and NRTN (Fig. 2a). The most significant association was for SNP rs708686 (P = 1.46e–58, β = –0.75) in FUT6, associated with a decrease in DFLNT and LNFP2 (Table 1). In contrast to SNPs on chromosome 19q13.33 above, SNPs in FUT3 (e.g., rs28362459) and neighboring genes were associated with higher concentrations of 2’FL and LNFP1 (Fig. 2d, e, Supplementary Data 1 and 2). Interestingly, while the concentration of HMO-bound fucose was not affected by this FUT3 SNP, that of HMO-bound sialic acid was significantly lower among homozygotes (P < 0.0001) (Fig. 2b). Specifically, this SNP was associated with lower 3’SL (P < 0.0001) but higher 6’SL concentrations (P < 0.05) (Supplementary Data 1, Fig. 2c); however, none of the extended sialylated HMOs such as LSTb, LSTc, DSLNT or DSLNH were affected by this SNP (Supplementary Data 1). Moreover, the alpha1-3-fucosylated HMO 3FL was not significantly associated with this FUT3 SNP, but DFLac, which is both alpha1-2- and alpha1-3-fucosylated, was significantly reduced among homozygotes (P < 0.001) (Fig. 2d). Extended fucosylated HMOs were also affected by this FUT3 SNP: concentrations of the type-1 alpha1-4-fucosylated HMO LNFP2 were lower (P < 0.0001), whereas concentrations of the alpha1-2-fucosylated structural isomer LNFP1 were higher (P < 0.0001) and there was no association with the type 2 isomer, the alpha1-3-fucosylated HMO LNFP3 (Fig. 2e, Supplementary Data 1). These findings further emphasize the interconnectivity of HMO biosynthesis, illustrating multiple alternate fucosylation or sialylation mechanisms, which contribute to the overall HMO balance (Fig. 2f).

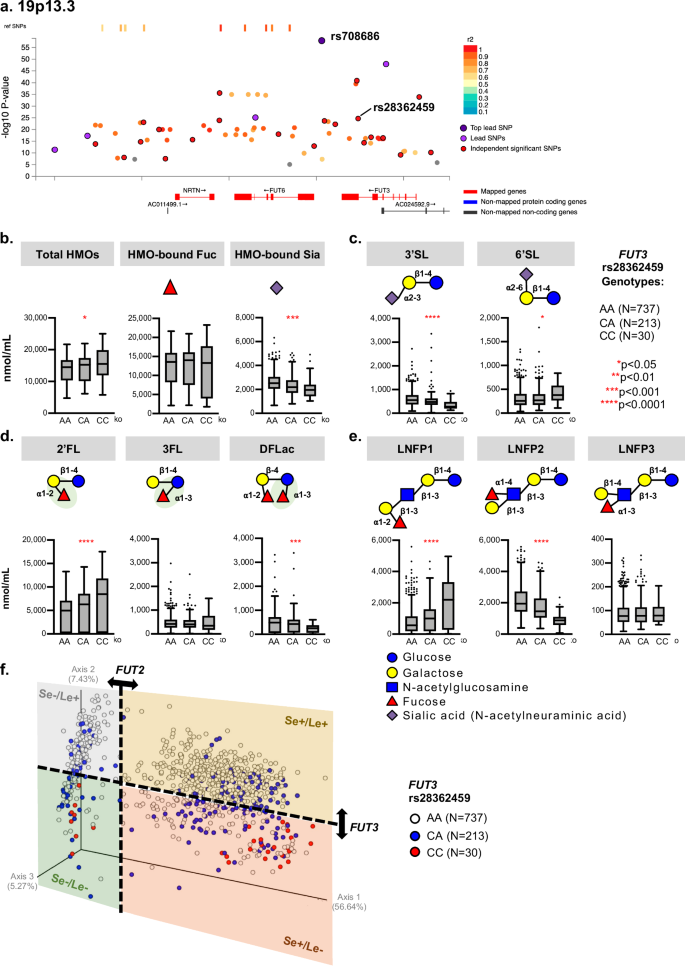
a Overlayed Locus Zoom plots of chromosome 19p13.3: 70 SNPs were associated with individual HMOs (linear regression analysis in PLINK; 26 independent signals and 5 lead SNPs, defined by (LD) r2 < 0.6 and r2 < 0.1, respectively). The most significant SNP (rs708686, P = 1.46e–58), located in the FUT6 gene, is represented by a dark purple dot. The x-axis identifies the genes mapped to this associated region and the y-axis indicates the significance of SNP associations (P < 5e–8). b–e HMO concentrations associated with rs28362459 in the FUT3 gene using Kruskal-Wallis (non-parametric) tests. Box minimum: Q1, box maximum: Q3, box center: median, whiskers (farthest points that are not outliers (i.e., within 3/2 times of interquartile range). b total HMO concentrations, P = 0.006; HMO-bound fucose, P = 0.12; and HMO-bound sialic acid, P = 5.55e–6; (c) differently sialylated lactose HMOs: 3’SL, P = 2.2e–11; 6’SL, P = 0.68; (d) differently fucosylated lactose HMOs: 2’FL, P = 9.83e–6; 3FL, P = 0.078; DFLac, P = 4.21e–4; and (e) different fucosylated pentasaccharides: LNFP1, P = 1e–12; LNFP2, P = 1e–12; LNFP3: P = 0.6468. Box minimum: Q1, box maximum: Q3, box center: median, whiskers (farthest points that are not outliers (i.e., within 3/2 times of interquartile range). f Principal Co-ordinate Analysis (PCoA) plot of overall HMO profiles by the FUT3 rs28362459 genotype using a Bray-Curtis distance matrix. Each dot represents the entire HMO profile of an individual mother. Variation along the secondary axis, which explains 7.43% of variation in overall HMO profiles, is partly driven by FUT3 rs28362459 genotype. Variation along the primary axis is driven by FUT2 secretor status (see Fig. 1e), dividing mothers into 4 groups based on FUT2 Secretor (Se) and FUT3 Lewis (Le) genotypes. Dashed lines are drawn arbitrarily to show the sectors with high or low numbers of Secretor (Se) and Lewis (Le) genotypes.
Chromosome 3q27.3 consists of four independent SNPs associated with elevated concentrations of 6’SL (3.92e–9 < P < 2.07e–8), indicating gain-of-function mutations (Fig. 3a). The most significant was SNP rs4686843 (lead SNP), located within the intron of the β-galactoside aplha2-6-sialyltransferase 1 (ST6GAL1) gene (Fig. 3b). This SNP was associated with higher concentrations of HMOs carrying an alpha2-6-linked sialic acid at the terminal galactose such as 6’SL and LSTc (Fig. 3b). This SNP was not associated with concentrations of 3’SL, indicating the enzyme only facilitates alpha2-6-, but not alpha2-3-sialylation. In addition, it was not associated with LSTb concentrations, indicating that the enzyme specifically catalyzes alpha2-6-sialylation to the terminal galactose, but not the internal N-acetyl-glucosamine (Fig. 3b). Figure 3c depicts associations with other sialylated HMOs such as DSLNH and LSTc (P = 8.22e–8, β = 0.26). Unlike the chromosome 19 SNPs, represented as clusters in the PCoA space, SNPs in ST6GAL1 were associated with specific sialylated HMOs (alpha2-6-linked sialic acid at the terminal galactose) but did not substantially drive overall HMO composition (Fig. 3d).

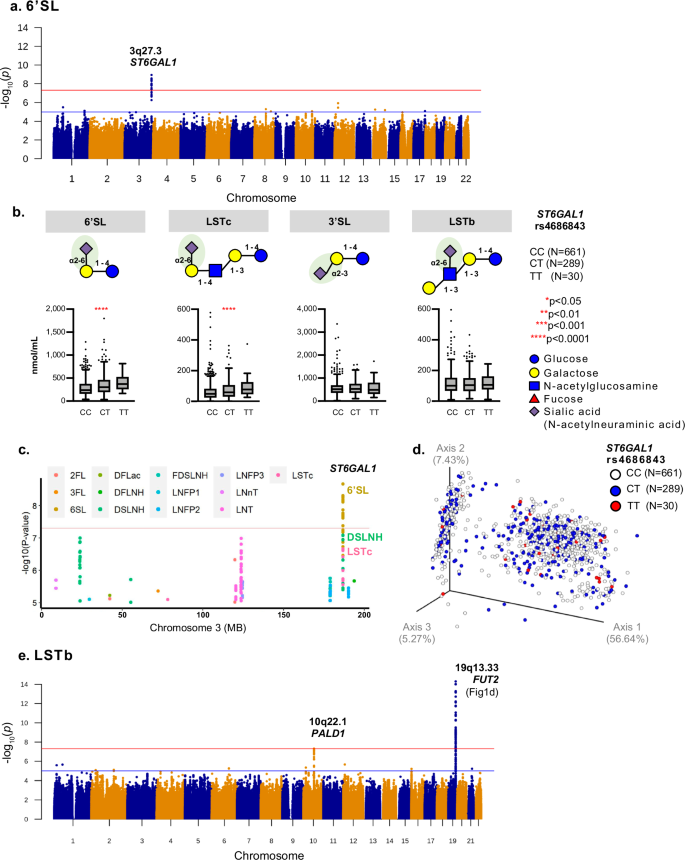
a Manhattan plot of GWAS for 6’SL: 19 SNPs on chromosome 3q27.3 in the ST6GAL1 gene were significantly associated with 6’SL (P < 5e–8). The most significant lead SNP was rs4686843 located in the intron of this gene. The x-axis indicates the chromosomal position and the y-axis indicates the significance of SNP associations (-log10(P)). b HMO concentrations associated with rs4686843 using the Kruskal-Wallis test (non-parametric, not assuming normal distribution): SNP associated with higher concentrations of 6’SL (P = 5.78e–9) and LSTc (P = 6.29e–6), but not 3’SL (P = 0.98) or LSTb (P = 0.98), indicating role in alpha2-6-sialylation specific at the terminal galactose. Box minimum: Q1, box maximum: Q3, box center: median, whiskers (farthest points that are not outliers (i.e., within 3/2 times of interquartile range). c Regional plot of genetic associations for 19 individual HMOs within chromosome 3q27.3: Significant associations detected only for 6’SL. Trends detected for DSLNH and LSTc but these do not meet genome-wide significance as indicated by the red horizontal line (P = 5e–8). Blue line is indicated by the suggestive significance (P = 1e–5). d Principal Co-ordinate Analysis (PCoA) plot of overall HMO profiles by rs4686843 using a Bray-Curtis distance matrix: No evidence of substantial association between this SNP and overall HMO profile. Each dot represents the entire HMO profile of an individual mother. e Manhattan plot of LSTb: 135 SNPs on chromosome 19q13.33 (habouring genes such as FUT2, lowest P = 2.4e–31) and a single SNP on chromosome 10q22.1 in the PALD1 locus (P < 5e–8) as indicated by the red line and were significantly associated with LSTb concentration. Blue line indicates the suggestive significance (P = 1e–5).
Chromosome 10q22.1 is a novel locus associated with lower LSTb concentrations (P = 4e–8, β = –0.29) and located within the phosphatase domain containing paladin 1 (PALDI) gene (Fig. 3e).
Conditional GWAS of HMOs identified novel associations
Conditional GWAS analyses using the 21 lead SNPs on chromosome 19 (Table 1) as covariates identified 28 additional novel SNPs on chromosomes 2q37.1, 7q.31.32, 16p13.2 and 18q22.3 as well as independent associations in 3q27.3, 19p13.3 and 19q13.33 (Fig. 4a and Supplementary Data 5). For example, in the 2q37.1 region, SNP rs13025087 in gene B3GNT7 was associated with increased concentration of 3’SL (P = 4.64e–08, β = 0.26). In region 7q.31.32, 19 SNPs within the same LD block were associated with increased concentrations of LNT, including an intergenic SNP, rs1881374 (P = 6.54e–10, β = 0.29). In 16p13.2, 7 SNPs within the same LD block were associated with increased concentrations of fucose-bound HMOs (e.g., rs4578629 an intergenic variant, P = 1.29e-08, β=0.35). Finally, we identified a SNP in 18q22.3, rs73472295, which was associated with decreased concentrations of DSLNT (P = 4.06e–08, β = –0.42).

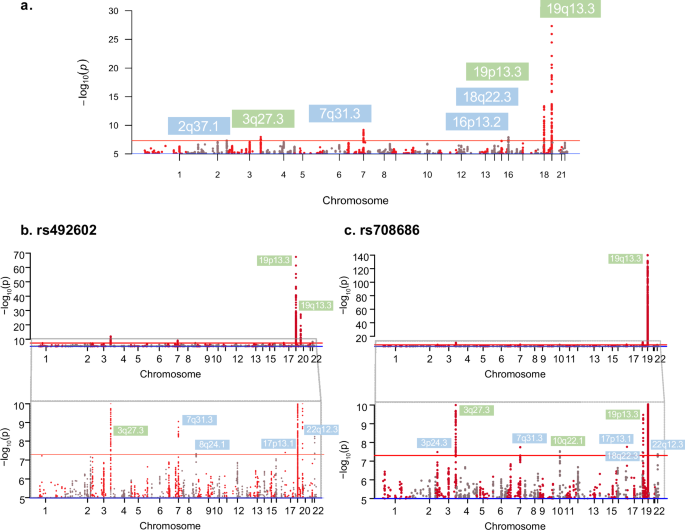
a Overlayed Manhattan plots from conditional GWAS analyses of 19 HMOs using linear regression to condition on 21 lead SNPs from Table 1 (N = 980). Loci highlighted in blue were novel associated loci identified by conditioning on 21 lead SNPs from chromosome 19. Loci highlighted in green are primary loci previously identified from our GWAS. Red line represents the genome-wide significance (P = 5e–8). b Overlayed Manhattan plots from conditional GWAS analyses on the lead SNP (rs492602, P = 2.38e–118) with the lowest P value at the chromosome 19q13.33 locus, which identified 3 new significant loci on chromosomes 8q24.13, 17p13.1 and 22q12.3 (highlighted in blue). Loci highlighted in green are primary loci previously identified from our GWAS. Red line represents the genome-wide significance threshold (P = 5e–8). Zoomed panel shows the loci within significance between P < 1e–05 and P < 5e–10. c Overlayed Manhattan plots from conditional GWAS analyses on the lead SNP (rs708686, P = 1.24e–58) with the lowest P value at the chromosome on 19p13.3 locus, which identified 4 new significant loci on chromosome 3p24.3, 17p13.1, 18q22.3 and 22q12.3 (highlighted in blue). Loci highlighted in green are primary loci previously identified from our GWAS. Red line represents the genome-wide significance (P = 5e–8). Zoomed panel shows the loci within significance between P < 1e–05 and P < 5e–10.
Subsequent conditional GWAS analyses using the top lead SNP rs492602 on chromosome 19q13.3 identified 3 new significant loci on chromosomes 8q24.13, 17p13.1 and 22q12.3. These loci were not detected in our initial GWASs of HMOs, nor were they significant when we conditioned on all 21 lead SNPs (Fig. 4b). In the 8q24.13 region, rs2954165 was significantly associated with increased concentration of 3’FL (P = 4.50e–08, β = 0.24). In the 17p13.1 region, rs7209048 was significantly associated with decreased concentration of DSLNT (P = 3.88e–08, β = –0.36). In the 22q12.3 region, 5 SNPs within the same LD block were associated with increased concentrations of FLNH (P = 5.66e–09, β = 0.28). In addition, we detected significant signals on chromosomes 19p13.3, 19q13.33, 3q27.3 and 7q31.32, which had been identified in our previous conditional analysis using all lead SNPs.
In addition, conditioning on the lead SNP with the lowest P value (rs708686, P = 1.24e–58) on chromosome 19p13.3 resulted in one novel genome-wide significant signal at chromosome 3p24.3 as well as a signal at 18q22.3, which was identified in our earlier conditional analysis using all lead SNPs (Fig. 4c, Supplementary Data 5, Supplementary Fig. S9a). In the 3p24.3 region, rs4858536 was associated with increased concentration of DSLNH (P = 3.27e–08, β = 0.24). In the 18q22.3 region, rs73472295 was associated with decreased concentration of DSLNT (P = 3.28e–08, β = –0.42). Moreover, two associations at chromosomes 17p13.1 and 22q12.3 were identified, which were noted above in conditional analysis of the top SNP at chromosome 19q13.33.
Conditional GWAS analysis using each of the 21 lead SNPs from chromosome 19 (Table 1) yielded similar results as described above (Supplementary Data 5, Supplementary Fig. S9a). Similarly, step-wise conditional analysis using the top one, two, three and more SNPs in each locus did not detect any additional signals (Supplementary Fig. S9b).
HMO-associated loci replicated in the INSPIRE Study
To validate our results from the CHILD Cohort Study, we undertook targeted replication analyses in a sub-cohort of 395 mothers from the INSPIRE Study10. This replication sub-cohort used the same HMO analysis platform as CHILD, paired with a different genomics platform that was not imputed, resulting in relatively fewer SNP genotypes for analysis. Of the 2,669 SNPs associated with HMOs (suggestive P < 1e–5) in CHILD, 281 were genotyped in INSPIRE, of which 46 replicated including: one SNP in 3q27.3 (rs4234598 in the ST6GAL1 gene, P < 0.05) (Fig. 5a), four SNPs in the 7q31.32 region (P < 0.0125) (Fig. 5b), and 41 HMO-associated SNPs from the 19p13.3 and 19q13.33 regions, which span the FUT2, FUT3, and FUT6 genes (P < 0.0014) (Fig. 5c).

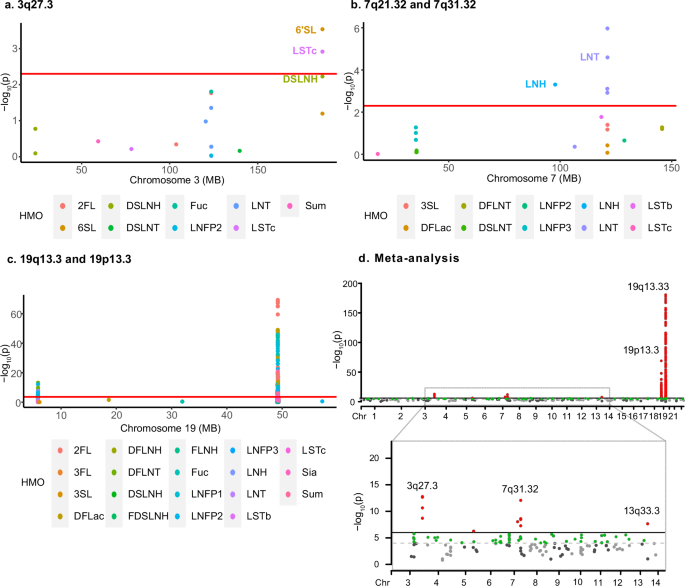
a–c Overlayed regional plots show replication of HMO-associated loci in the INSPIRE sub-cohort (N = 395): significant replications after Bonferroni correction for multiple testing surpass the red horizontal line. a SNP rs4234598 in locus 3q27.3 was associated with both 6’SL and LSTc. b Four SNPs in 7q31.32 were associated with LNT and one SNP (rs16869462) in 7q21.32 is associated with LNH. c A total of 41 SNPs in 19p13.2 and 19q13.33 loci were associated with all HMOs except 6’SL and LNnT in the INSPIRE sub-cohort. d Overlayed Manhattan plot of the meta-analyses of 19 HMOs combining the CHILD and INSPIRE sub-cohorts (N = 1375). Loci in red exceeded the genome-wide significance threshold (meta-P < 5e–08) and loci in green were suggestively associated (meta-P < 1e–05). Out of the 6 associated genomics regions, two were novel (7q21.32 and 13q33.3), not previously identified in either the CHILD or INSPIRE sub-cohorts alone.
Using a meta-analysis approach, we combined the association results from all 281 overlapping SNPs in the CHILD and INSPIRE sub-cohorts (total N = 1375). This identified 6 loci associated with HMOs (P < 5e–08) including chromosomes 3q27.3, 7q21.32, 7q31.32, 13q33.3, 19p13.3 and 19q13.33 (Fig. 5d and Supplementary Data 6). Two of these regions were not significantly associated with HMOs in either the CHILD or INSPIRE cohort studies alone, but only identified in the meta-analysis combining the two sub-cohorts. These include chromosome 7q21.32, which consists of an intronic SNP in LMTK2 gene, rs16869462, associated with decreased concentrations of a neutral HMO LNH (P = 9e–09, β = –5.75). The second novel locus is on chromosome 13q33.3, which includes SNP rs79783730, significantly associated with increased concentrations of LNT (2.21e–08, β = 5.59).
Gene-by-environment interaction analyses identified specific HMOs that may protect respiratory health of human milk-fed children
Of the 980 mothers with both genetic and HMO profiles, 198 (20%) of their children had experienced recurrent wheeze between 2 and 5 years of age. Recurrent wheeze was strongly associated with two genetic risk scores (GRS): one generated based on 44 SNPs associated with asthma, regardless of age of onset12 (denoted as all-asthma GRS, Supplementary Fig. S10), and the second based on 4 SNPs associated with childhood-onset asthma (denoted as childhood-asthma GRS). As shown in Fig. 6a, both GRSs were strongly associated with recurrent wheeze prevalence (P = 2.48e–10 and P = 1e–7).

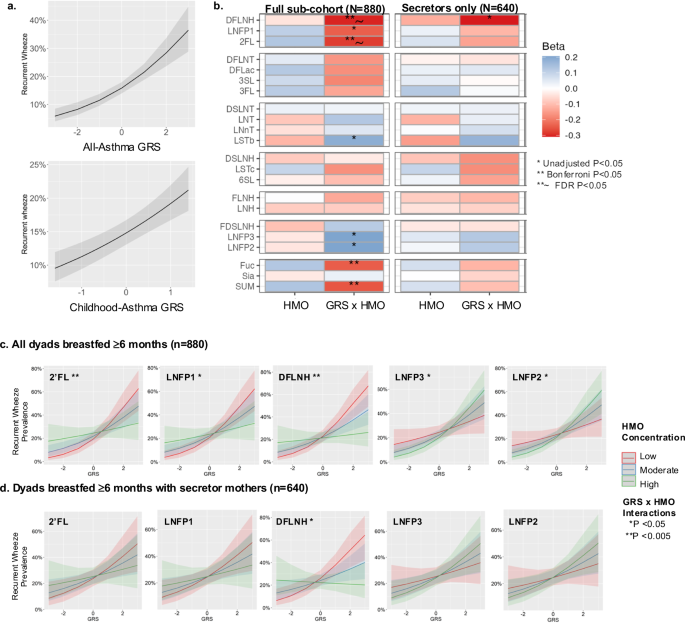
a Association of all-asthma GRS and childhood-asthma GRS with recurrent wheeze between ages 2 and 5 years (N = 2835; P = 2.48e–10 and P = 1e–7, respectively). The x-axes indicate GRS Z-scores and the y-axes indicate the prevalence of recurrent wheeze. b–d Gene-environment interaction (GxE) analyses using logistic regression analyses indicate that exposure to specific HMOs modulate risk of recurrent wheeze among human milk-fed children in the sub-cohort (N = 880 children of all mothers with HMOs and genomics data) as well as in the sub-cohort of 640 secretor mothers. Unadjusted *P < 0.05; Bonferroni adjusted **P < 0.05; FDR adjusted **~P < 0.05. Normalized HMO concentrations were categorized as Low (<–1 SD), Moderate (–1 to +1 SD) and High (>+1 SD) represented as bands and colors. Exposure to low levels of three HMOs (e.g., 2’FL, LNFP1, DFLNH) is associated with increased prevalence of recurrent wheeze among children with high GRS (P < 0.05). GxE unadjusted P values using generalized linear model: 2’FL; P = 0.004, LNFP1; P = 0.01, DFLNH; P = 0.002). In contrast, exposure to high levels of other HMOs (e.g., LNFP2, LNFP3) is associated with increased prevalence of recurrent wheeze among children with high GRS (GxE Unadjusted p values: LNFP2; P = 0.03, LNFP3; P = 0.02). Full summary statistics are provided in Supplementary Tables 4, 5.
In GxE analyses using the all-asthma GRS and restricting to children who were human milk-fed for at least 6 months (N = 880), we determined that exposure to specific HMOs was associated with prevalence of recurrent wheeze, particularly among those with high genetic risk (Fig. 6b, c, Supplementary Table 4). For example, among children with high GRS, exposure to high concentrations of certain HMOs (2’FL, DFLNH – which are higher in secretor milk) as well as total HMOs and total HMO-bound fucose was associated with reduced prevalence of recurrent wheeze (Fig. 6b) (interaction P < 0.01). Notably in this high-GRS group, exposure to high concentrations of certain other HMOs (LNFP2, LNFP3 – which are higher in non-secretor milk) were associated with higher prevalence of recurrent wheeze. Thus, these interactions suggest that among individuals with high genetic risk, exposure to specific HMOs modulate their overall risk of recurrent wheeze. We observed similar trends using the childhood-asthma GRS (Supplementary Fig. S11). These results contrast with GxE analyses using breastfeeding duration (3, 6, and 12 months) instead of HMO concentrations, which do not show significant modulating effects (Supplementary Fig. S12).
Finally, we performed a sensitivity analysis to determine if these findings were driven by secretor status (which affects glycosylation throughout the entire body – not only in milk) rather than specific HMO exposures. When restricting our analyses to secretor mothers only (N = 640 with children who were human milk-fed until 6 months or longer), we observed similar trends between the GRS and HMOs (Fig. 6b, Supplementary Table 5). For example, DFLNH interacts with the all-asthma GRS (P < 0.05) so that children with high genetic risk exposed to high concentrations of this HMO showed reduced prevalence of recurrent wheeze compared to children with similarly high GRS exposed to low DFLNH. Similar trends, albeit not significant, were also observed for 2’FL and LNFP1, but inverse interaction effects were observed for LNFP2 and LNFP3.
link